USMS Times Ratings: Description and Explanation
This page provides an explanation of the Time Ratings. For more details, follow the link to the Record Curves Details page.
Contents
- What is it?
- Why Rate Times?
- The Record Curves
- Performance Rating Calculation
- What is a Good Rating?
- Caveats
- More Information
What is it?
A time rating numerically compares a swimmer’s time against a theoretical record time for their age, course, and event. The theoretical record is obtained from a curve fit of records for all ages for a given event and course. A time exactly equal to the theoretical record would be rated at 100; ratings over 100 are also possible.
Why Rate Times?
The idea is to adjust for age, gender and event. For example, most people will get slower as they age. Time ratings allow one to compare a recent time to one swum (say) 10 years ago. Sure, the time may be slower...but perhaps your peers have gotten slower still. Rating your time allows one to adjust for the effects of aging and basically ask the question: is this time better for my age group? Likewise, by rating your time you can easily compare performances in different events or courses (short course or long course).
A primary reason to rate times may be for goal setting. Trying to improve one's time year after year is a laudable goal, but probably doomed to failure in the long term. Another alternative is to maintain or improve one's performance ratings.
The Record Curves
The heart of the time rating procedure is the construction of a record curve for each event. The fastest masters times in the world are collected for each event and age group, and then a curve (an exponential function) is fitted to the times as a function of age. An example is shown below for the men's 100 yard freestyle.

The record curve describes the expected effect of aging on time for a given event. For some events (e.g. 200 fly) the effect can be greater than others. Records curve parameters are calculated using the world best times (USMS National Records for SCY or FINA World Records for SCM and LCM) for each event and used to rate a masters swim performance.
More details on the construction of the record curves—including the individual curve parameters—can be found here.
Performance Rating Calculation
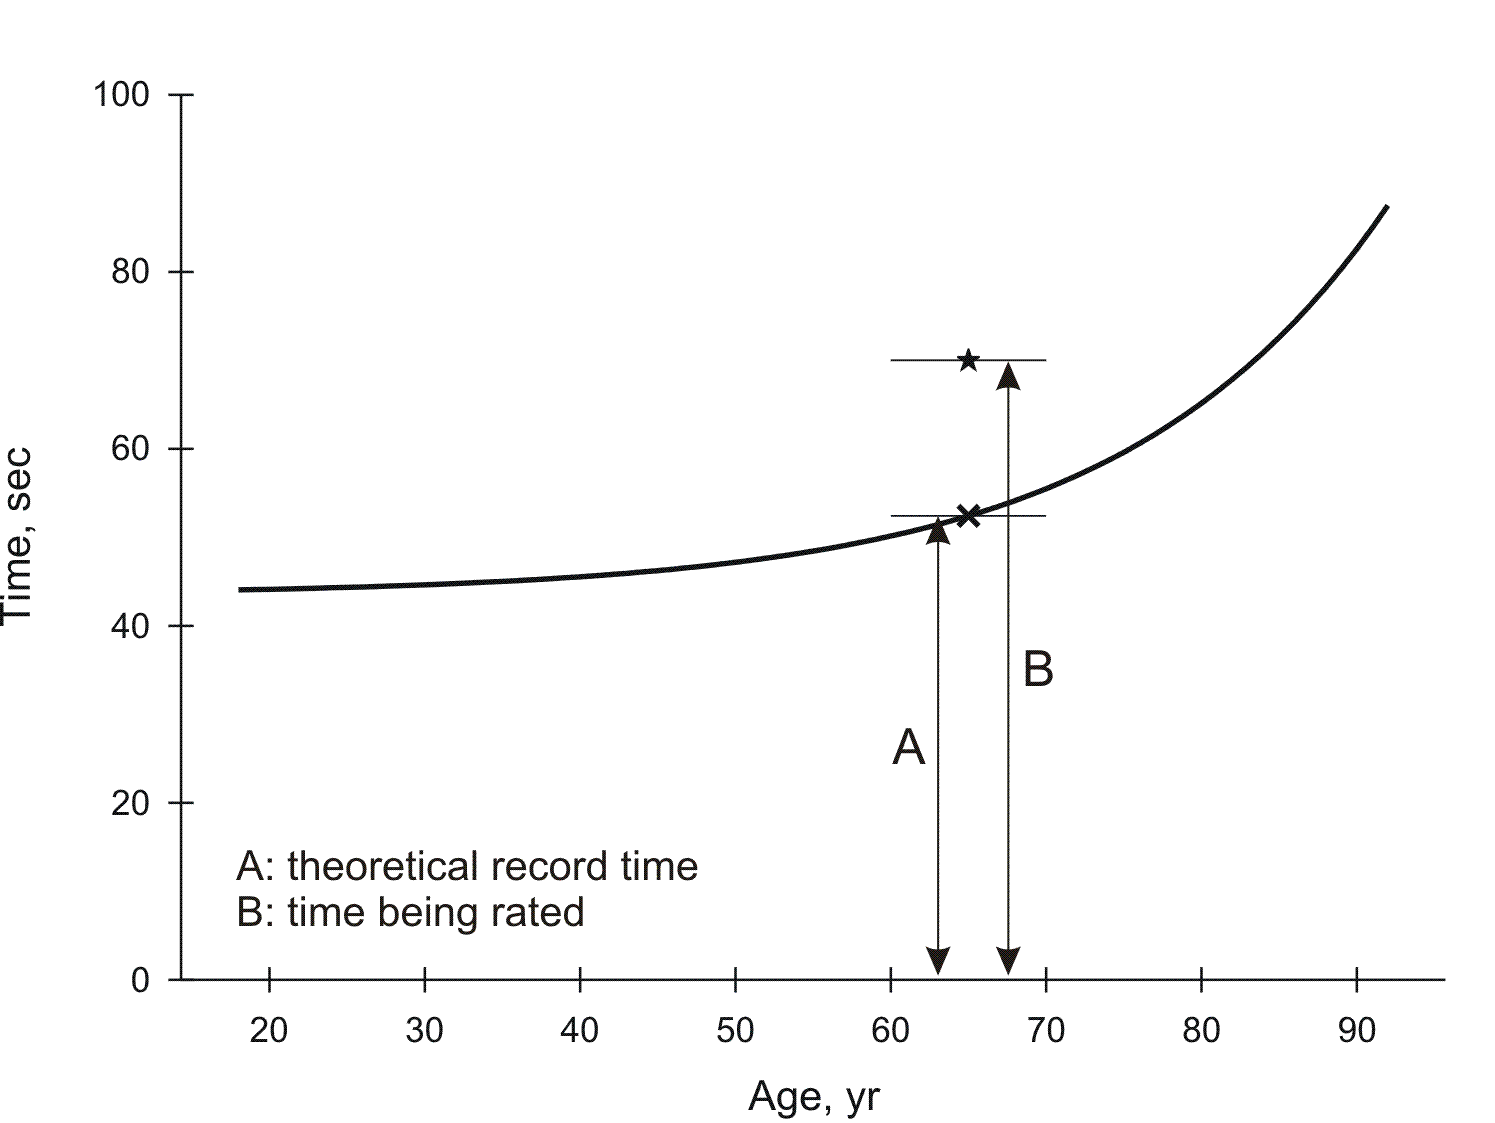
A particular swim is rated by dividing the "ideal record" (as obtained from the fitted record curve) by the time of the swim in seconds and then multiplying by 100. The concept is shown graphically in the following image:

In the image, the star represents the time being rated (in this case, for a 65-year-old male swimming the 100 yd free) and the X represents the predicted record from the record curve. The times are represented by the double-arrow lines. The rating is calculated in this case by dividing A by B and then multiplying by 100. All times above the curve -- the vast majority of performances -- will have ratings below 100 while times below the curve (which are rare) will have ratings greater than 100.
What is a Good Rating?
Naturally the answer to this question is "it depends." If you consistently improve your ratings over the years, it means you are beating the "aging curve." In other words, age has less impact on your times than on USMS/World records -- that's a great feat!
What is good for elite swimmers who are consistently in the Top 10? In an attempt to provide some guidance, all the Top 10 swims from the 2007 Short Course Yards season were rated. The table below summarizes the results in terms of the 25th, 50th and 75th percentiles (the Xth percentile rating is the rating that is better than X% of the swims).
| 25% | 50% (median) | 75% | |
|---|---|---|---|
| USMS Records | 98.20 |
99.73 | 101.33 |
| #1 Swims | 92.47 |
95.46 | 98.06 |
| #10 Swims | 80.10 |
86.64 | 89.83 |
There is some overlap between these types of swims, and this can be seen in the distribution of ratings shown below.

To generalize: ratings above 98 are possible "record-worthy" performances, ratings in the range 92-98 are comparable to typical top-rated swims, while ratings in the range 80-90 are typically "Top 10-worthy" swims. Of course, there are no guarantees; for example, the highest-rated #10 swim in SCY-2007 scored an impressive 95.13, better than nearly half of the top-ranked swims of the year! The 11th swimmer in that event probably achieved an excellent rating, comparable to very many top-ranked swims...and didn't even make the Top 10. Some people are just unlucky enough to swim in very competitive age-groups and events. One advantage of the rating calculations is that it is "blind" to such considerations.
Caveats
Although useful for goal-setting and perhaps other purposes, performance ratings have some disadvantages. In particular:
- Record curves should be updated as records change. This will modify the record curves and hence the rating calculated for a given swim. Since records by their nature will get faster, that means that the rating assigned to a particular swim performance will tend to decrease somewhat over time.
- There is greater uncertainty in the ratings for performances by swimmers in the older age groups (say, above 80 years old). There are two reasons for this. First of all, the records themselves are more variable because there are fewer swimmers; in extreme cases, there are only one or two recorded swims for an event. Secondly, the record curve can be greatly influenced by times in the older age groups; these times can unduly "pull" the fit toward them.
That isn't to say that performance ratings aren't useful, just take them with a grain of salt, particularly in the older age groups.
For More Information
Please address any questions or comments to Chris Stevenson.


